The analyser
The analyser draws a live spectrum: frequency across, level up. It is how you see what a microphone is actually picking up, where a room resonates, and which frequency is ringing before it becomes a howl.
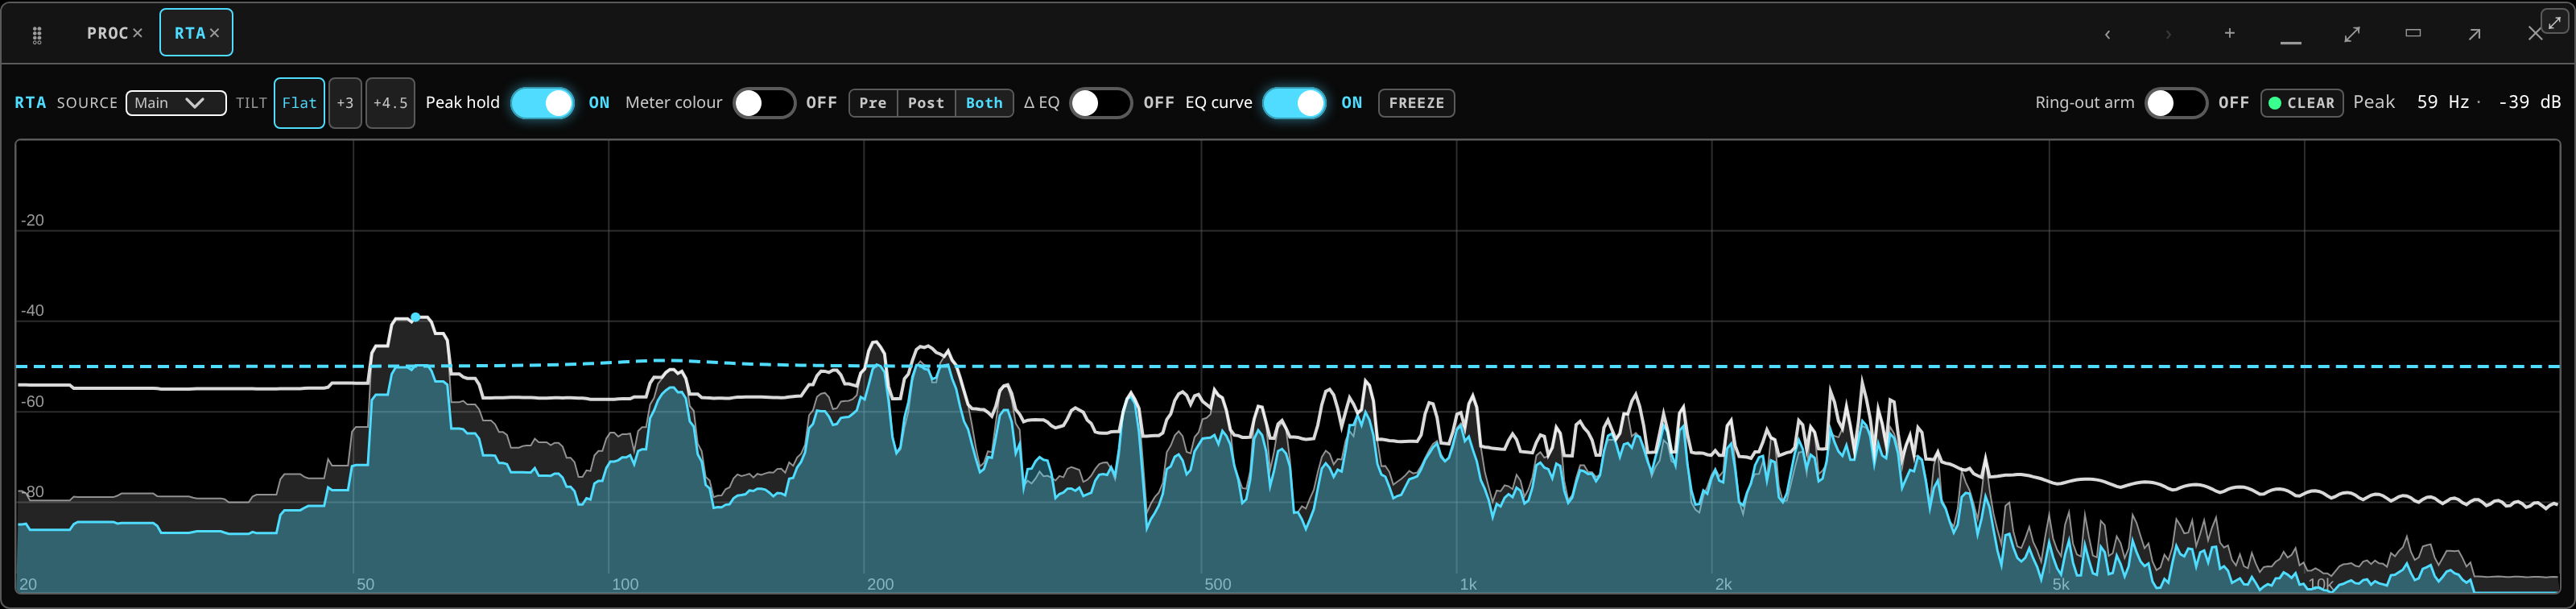 The analyser: the live spectrum of the chosen source, with the tilt reference, the peak readout and the trace controls.
There are two of it, and they are the same instrument:
- Meters ▸ Analyzer — a panel of its own, pointed at any source you choose.
- The trace window in the channel view — the same trace behind the channel's own EQ curve, so you shape the curve over what you are looking at. It is on every processing chip, not only the EQ one, and the thin line along it carries the analyser's controls wherever you are in the chain.
Both carry the same controls, in the same order, with the same words.
Reading it
- Across — 20 Hz on the left to 20 kHz on the right, on a logarithmic scale, with octave landmarks marked at 20, 50, 100, 200, 500 Hz and 1, 2, 5, 10, 20 kHz. A console running at a rate whose top is below 20 kHz plots up to its own limit instead.
- Up — 0 dBFS at the top down to −100 dBFS at the floor.
- Resolution — a 16384-point analysis at the console's 96 kHz reference rate, drawn as between 128 and 640 bars depending on how wide the panel is. Widening the panel buys you detail rather than bigger bars.
Near-silence draws as silence. When nothing in the frame rises above −60 dBFS the panel draws a flat floor rather than lifting the noise floor into a knee-high block of bars. Anything real playing brings the whole spectrum back, its quiet detail included.
The controls
| Control | What it does |
|---|---|
| Source | Which strip is analysed — an input, a bus, or the mains. |
| Tilt | The reference slope the trace is drawn against. |
| Peak | The loudest band right now, its frequency and its level. |
| Peak hold | Leaves a mark at each band's highest reading so a transient does not vanish before you have read it. |
| Meter colour | Colours the trace by level instead of drawing it in one colour. |
| Tap | Whether the trace is taken Pre the EQ, Post the EQ, or Both at once. |
| Δ EQ | Shades the gap between the pre and post traces — amber where the EQ boosts, blue where it cuts. Needs the tap on Both. |
| Freeze | Holds the live trace still so you can look at it. |
| EQ curve | Draws the analysed source's EQ response over the spectrum, for reference. It has no handles here and never follows the tilt — a transfer curve is not a spectrum. |
| Ring-out arm | Turns on the feedback ring markers. Off by default. |
About the tilt
Raw spectrum magnitude is not what your ears do. Music and pink noise both fall off with frequency, so a flat-sounding mix drawn flat looks like it is losing its top end.
Flat shows the raw magnitude. The pink tilt references draw the trace against a falling slope, so material that sounds balanced draws roughly level and a genuine hump or hole is obvious. Pick the slope that makes your usual programme material sit flat, then read departures from it.
The tilt changes the display and never the audio.
About Pre / Post / Both
Pre is what arrives at the EQ. Post is what leaves it. Both draws them together, which is what you want while you are working: with Δ EQ on, the shaded gap between them is exactly what your EQ is doing, drawn on the material rather than as a theoretical curve. Δ DRIVE does the same for the drive stage: the signal entering it is drawn as a ghost under the signal leaving it, so the harmonics the drive added read as the gap.
If a source is muted, the panel says so. A post-EQ trace on a muted channel is floored; a trace that is still painting is the pre-EQ input, which is a useful thing to see and a confusing one if you have not noticed the badge.
Two chips sit on the analyser's line to say so: Muted (red) when the analysed source is muted, and No post-EQ when this source has no post-EQ trace at all, so what you see is its pre-EQ input, dimmed. The channel view's own trace line carries the same Muted chip.
Seeing a feedback ring
Ring-out arm turns on the feedback markers. When it is on, the analyser flags the bands that look like a ring rather than like music, and a trace log below records what was flagged and when. Each flagged band is a red chip with its frequency; hover it for the notch the desk would suggest, its depth and Q.
A ring on the analyser looks different from music, once you have seen one:
- A single, very narrow spike, one bar wide, where music is broad.
- It stays put. A musical note moves; a ring sits on one frequency because the frequency belongs to the room, not to the player.
- It grows steadily rather than being struck and decaying.
- Often its harmonics come up with it at exact multiples, as the loop gets going.
The markers are off by default on purpose: a sustained musical tone — an organ pedal, a held synth pad, a bowed note — has the same narrow, stable shape and gets flagged. Arm them when you are ringing a room out, not through a set.
Seeing a ring and fixing it are different jobs. The analyser shows you; the automatic corrector plants the notch. See feedback suppression, and its worked example.
The trace window and the FX curve window
The channel view's second row holds two pictures, side by side:
| Window | What you see |
|---|---|
| The EQ graph + RTA window | The analyser, with the channel's EQ response over it — on every chip, always. |
| The FX space's curve window | The picture of the chip you have open — the gate's or compressor's transfer curve with its live gain reduction, the drive's shaper, the delay's tap train, the reverb's decay — beside the chips it belongs to. |
Neither window takes the other's place. Opening the gate shows the gate's curve next to the chips and leaves the spectrum where it was, so you can read the notch you are cutting and the threshold you are setting at the same time; the analyser's peak hold, colour, tap, Δ and any freeze are never touched by a chip press. A chip with no picture of its own — EQ, whose picture IS the analyser's surface, or sends — draws no curve window at all, and the room it would have taken goes to the windows beside it.
The analyser's own controls stay on its line, so the trace never loses them.
Why a channel is armed
The RTA switch on a channel is not the only thing that arms its analyser, so the bar beside
the switch says who is holding it — armed: SEL, FBS means the channel is both the
selected strip and under feedback detection.
The reasons the desk names:
| Reason | What it means |
|---|---|
| SEL | This channel is the console's selected strip. |
| MANUAL | You armed it with the RTA switch. |
| FBS | The feedback suppressor is hunting on this channel. |
| HRP | The harmonic processor is analysing this channel. |
| ALIGN | An alignment measurement is using this channel — its own, or as the reference. |
| ROOM | A room measurement is using this channel. |
They are independent. Turning the RTA switch off drops MANUAL and nothing else, so a channel FBS is working on stays armed and keeps saying so; selecting another strip drops SEL and leaves the rest. The analyser goes off only when the last reason lets go.
Of the six, MANUAL is the only one a show file remembers: saving a session stores the channels you armed yourself, never the one that happened to be selected or the ones a detector was working on when you saved.
Nothing computes unwatched
An analyser that is not on screen is not running. The console only produces a spectrum for a panel that is actually displayed, which is why the trace takes a moment to arrive when you open the panel or switch strips, and why leaving analysers armed all over the desk does not cost you anything.
This is also why the trace behind the EQ curve follows the selected strip: the feed is pointed at the strip you are looking at.
Related
- EQ and dynamics — the curve the trace sits behind.
- Feedback suppression — the automatic corrector.
- The harmonic processor — the other reader of this spectrum.
- Metering and latency — level metering, which is a different job.