Metering and latency
The meter bridge
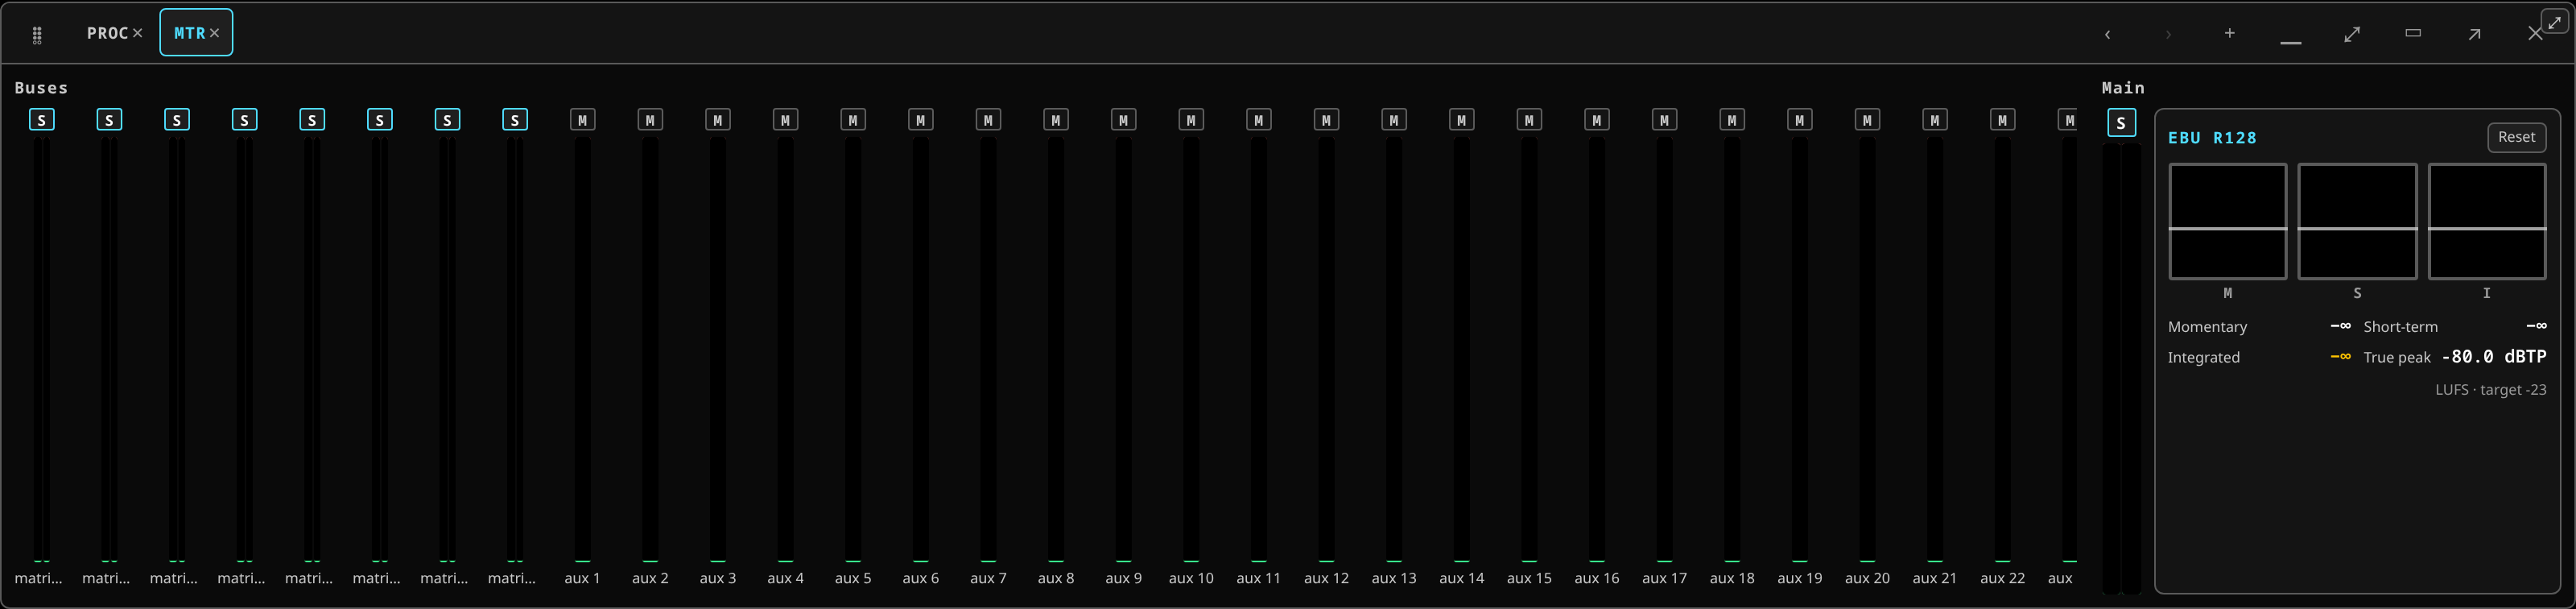 The meter bridge: every strip at once, with peak-hold and clip.
The Meter bridge chip shows the full metering picture with peak-hold and clip indication across the console.
Beside the mains it carries an EBU R128 loudness meter: momentary, short-term and integrated LUFS with true-peak, against a −23 target. It is measured in the engine when a server is running, and estimated from the mains otherwise.
Meters on the strips
Every strip tile carries its own meter — one column for a mono channel, an L/R pair for a linked or stereo strip, each with peak-hold.
The state dot at the top of the tile is the fast read across a whole wall: grey for silence, green for signal, red for clip, and a distinct colour when a feedback ring has been flagged on that channel.
Latency
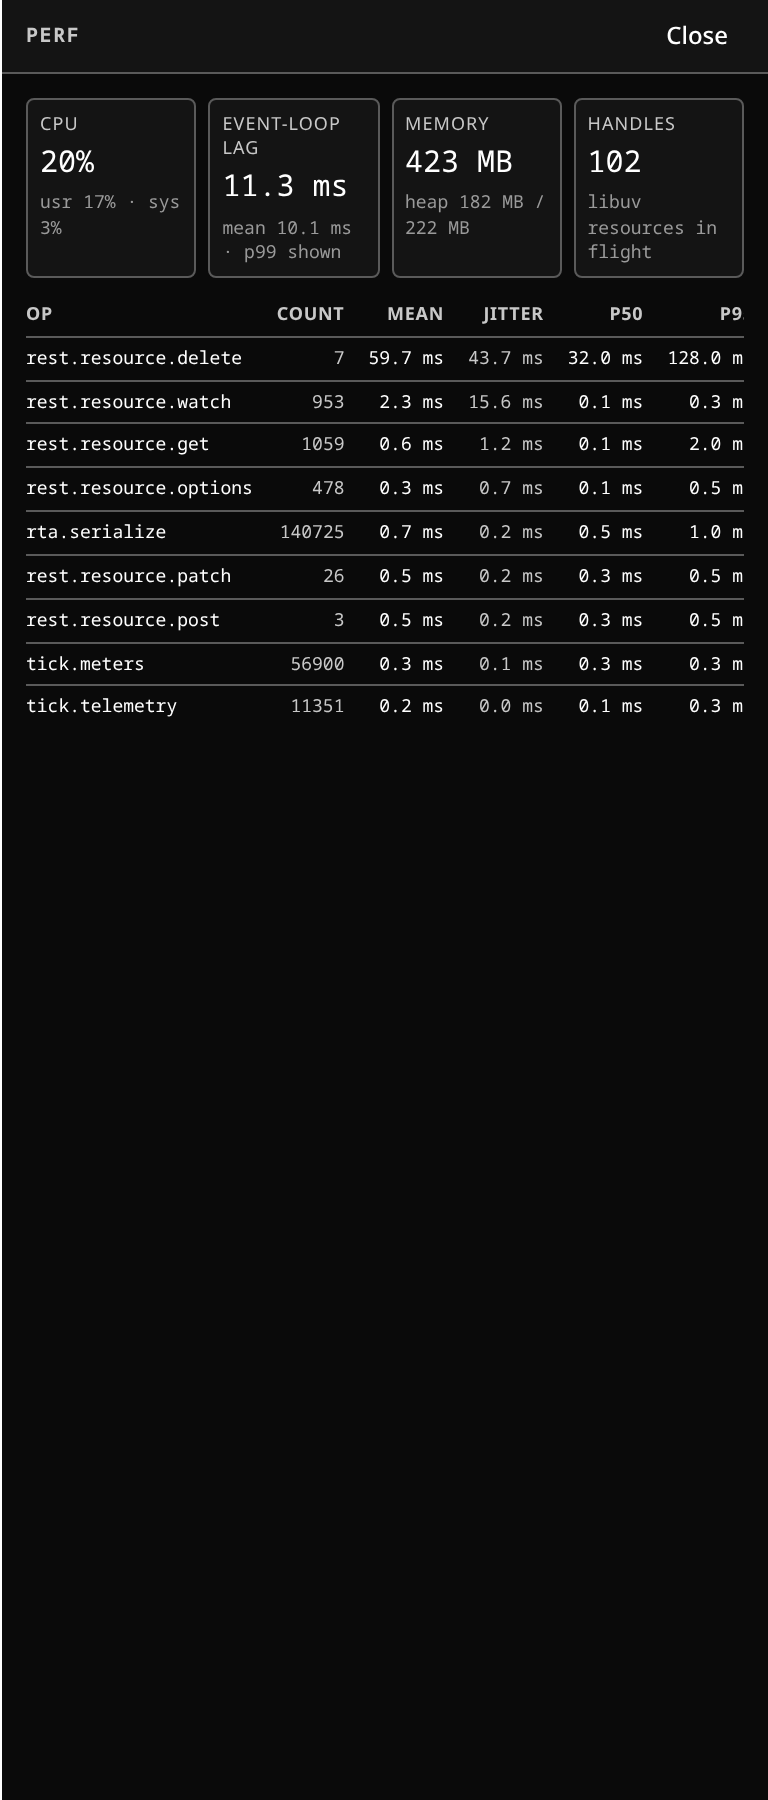 The performance panel: quantum, graph load and the xrun counter behind the latency figure.
A software mixer adds latency, and this desk reports it rather than hiding it.
- Channel latency badges on each tile open that channel's breakdown, and turn hot when the path runs long.
- The plugin rack sums the chain's latency at the foot and shows each unit's own contribution.
- The telemetry panel reports the mains-path latency, the buffer quantum, the sample rate, a live xrun counter, and a per-channel, per-plugin breakdown, with a warning when a path runs hot. The warning is a red ⚠ chip carrying the figure, on any path where the latency openmixer itself introduces goes past the 2 ms budget.
Where it comes from
Three contributions, in rough order of size:
- The buffer quantum. The graph-wide trade: a bigger quantum is more headroom and more latency.
- Plugin inserts. Some plugins — linear-phase EQ, look-ahead limiters — cost a great deal. The catalog reports each plugin's figure and can hide the ones that are not live-safe.
- The transport, on a rig with a stagebox.
Delay compensation keeps channels aligned with each other. It cannot make the total smaller — a heavily-processed channel forces the rest to wait for it.
Reading the xrun counter
An xrun is the graph missing a deadline: a click or a dropout. The counter should sit still. A counter that climbs means the graph is out of time, and the causes are covered in xruns and driver election.
Watch it during soundcheck with the full plugin load in place, not on an idle console.
Checking the sample rate
Telemetry reports the graph's rate: the rate the console's clock is set to, on the Setup page, 192 kHz where the hardware allows it. A stagebox segment paces at its own wire rate, 44.1, 48 or 96 kHz as set in the REAC clock panel, and the box follows that pace. The panel shows it beside the graph's rate. The two do not have to match: the REAC daemon converts between them at the segment, and that conversion is clean. A box that sounds granular is a segment that changed rate without re-pacing its box, not a graph at the wrong rate.
The clock panel itself — both tabs, and every segment control — is the clock.
A soft meter is not proof
Meters tell you what the mixer received. They do not tell you that phantom power reached a microphone, that an amplifier is on, or that a wedge is plugged in. For anything physical, confirm physically.