
OpenMixer
Curves on the plugin's screen
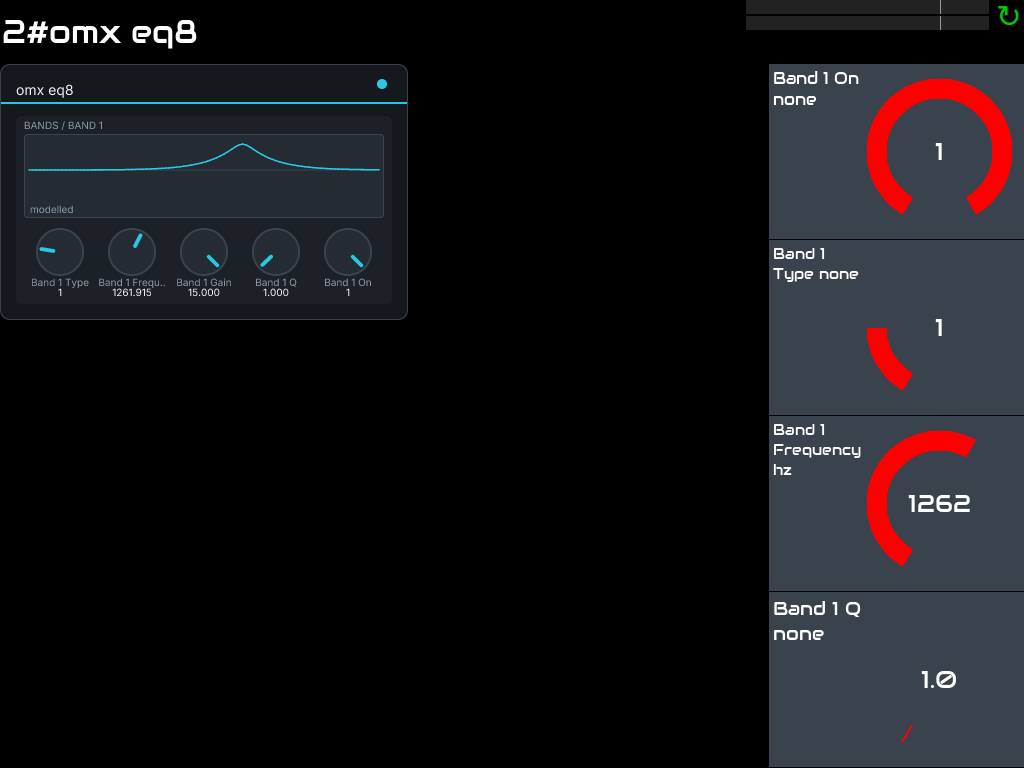
An equaliser on a Zynthian chain has a screen of its own that draws its response curve, and the curve follows every change you make.
What it is
A plugin that declares a curve, such as the frequency response of omx eq8, gets a screen of its own, drawn by OpenMixer's panel renderer. The curve is not a picture: plugin-hostd computes it from the plugin's current settings each time it is drawn.
Where it appears
On the chain's control screen, on the plugin's own pages.
What you do
Turn a band's gain, frequency or width with the controller knobs beside the panel: the curve is drawn again from the value you set. The knobs drawn inside the panel show the values; they are not turned by touch.
What you see
The plugin's sections and their controls, with the curve drawn above them.
Not yet
The compressor's transfer curve (omx comp) is not drawn on Zynthian yet. It comes when omx-panel reads the compressor's own panel over the description plugin-hostd writes of it.
The pull requests this page covers: omx-panel #1, omx-plugins #6, zynthian-ui #48, zynthian-ui #49